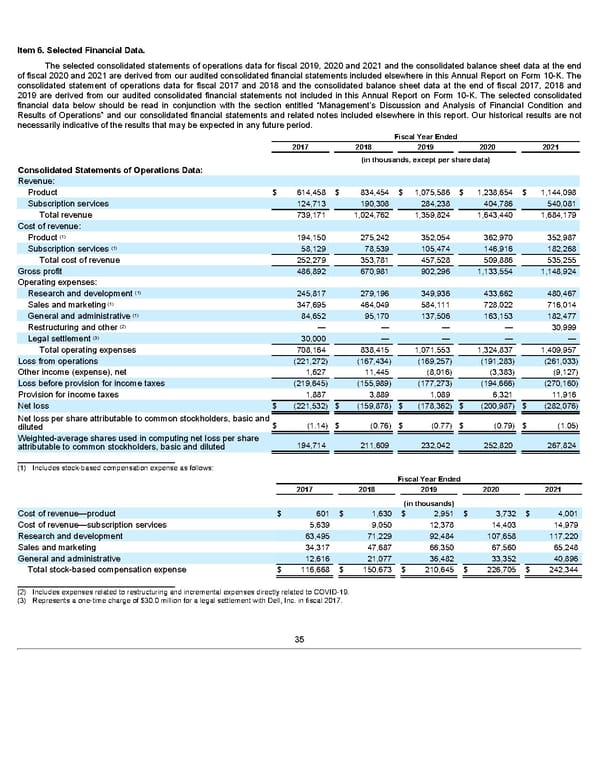
Item 6. Selected Financial Data. The selected consolidated statements of operations data for fiscal 2019, 2020 and 2021 and the consolidated balance sheet data at the end of fiscal 2020 and 2021 are derived from our audited consolidated financial statements included elsewhere in this Annual Report on Form 10-K. The consolidated statement of operations data for fiscal 2017 and 2018 and the consolidated balance sheet data at the end of fiscal 2017, 2018 and 2019 are derived from our audited consolidated financial statements not included in this Annual Report on Form 10-K. The selected consolidated financial data below should be read in conjunction with the section entitled “Management’s Discussion and Analysis of Financial Condition and Results of Operations” and our consolidated financial statements and related notes included elsewhere in this report. Our historical results are not necessarily indicative of the results that may be expected in any future period. Fiscal Year Ended 2017 2018 2019 2020 2021 (in thousands, except per share data) Consolidated Statements of Operations Data: Revenue: Product $ 614,458 $ 834,454 $ 1,075,586 $ 1,238,654 $ 1,144,098 Subscription services 124,713 190,308 284,238 404,786 540,081 Total revenue 739,171 1,024,762 1,359,824 1,643,440 1,684,179 Cost of revenue: (1) Product 194,150 275,242 352,054 362,970 352,987 (1) Subscription services 58,129 78,539 105,474 146,916 182,268 Total cost of revenue 252,279 353,781 457,528 509,886 535,255 Gross profit 486,892 670,981 902,296 1,133,554 1,148,924 Operating expenses: (1) Research and development 245,817 279,196 349,936 433,662 480,467 (1) Sales and marketing 347,695 464,049 584,111 728,022 716,014 (1) General and administrative 84,652 95,170 137,506 163,153 182,477 (2) Restructuring and other — — — — 30,999 (3) Legal settlement 30,000 — — — — Total operating expenses 708,164 838,415 1,071,553 1,324,837 1,409,957 Loss from operations (221,272) (167,434) (169,257) (191,283) (261,033) Other income (expense), net 1,627 11,445 (8,016) (3,383) (9,127) Loss before provision for income taxes (219,645) (155,989) (177,273) (194,666) (270,160) Provision for income taxes 1,887 3,889 1,089 6,321 11,916 Net loss $ (221,532) $ (159,878) $ (178,362) $ (200,987) $ (282,076) Net loss per share attributable to common stockholders, basic and $ (1.14) $ (0.76) $ (0.77) $ (0.79) $ (1.05) diluted Weighted-average shares used in computing net loss per share 194,714 211,609 232,042 252,820 267,824 attributable to common stockholders, basic and diluted _________________________________ (1) Includes stock-based compensation expense as follows: Fiscal Year Ended 2017 2018 2019 2020 2021 (in thousands) Cost of revenue—product $ 601 $ 1,630 $ 2,951 $ 3,732 $ 4,001 Cost of revenue—subscription services 5,639 9,050 12,378 14,403 14,979 Research and development 63,495 71,229 92,484 107,658 117,220 Sales and marketing 34,317 47,687 66,350 67,560 65,248 General and administrative 12,616 21,077 36,482 33,352 40,896 Total stock-based compensation expense $ 116,668 $ 150,673 $ 210,645 $ 226,705 $ 242,344 _________________________________ (2) Includes expenses related to restructuring and incremental expenses directly related to COVID-19. (3) Represents a one-time charge of $30.0 million for a legal settlement with Dell, Inc. in fiscal 2017. 35
 Annua lReport Page 34 Page 36