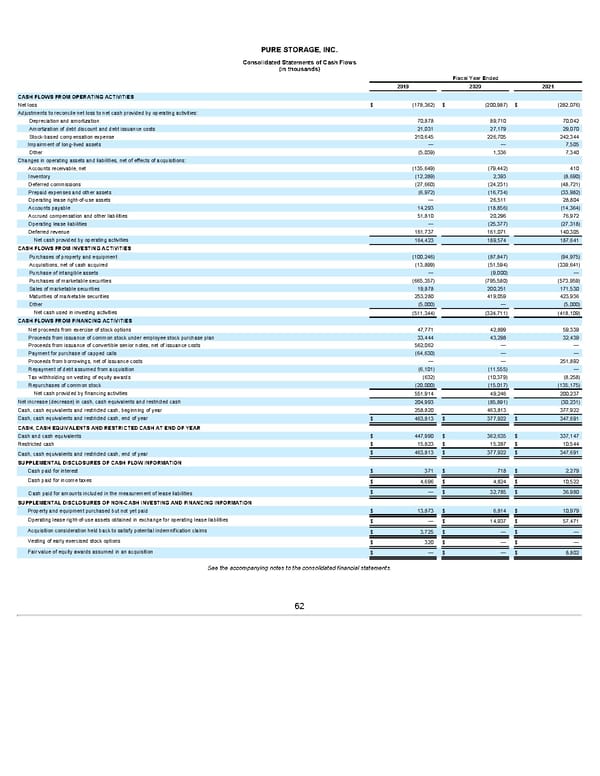
PURE STORAGE, INC. Consolidated Statements of Cash Flows (in thousands) Fiscal Year Ended 2019 2020 2021 CASH FLOWS FROM OPERATING ACTIVITIES Net loss $ (178,362) $ (200,987) $ (282,076) Adjustments to reconcile net loss to net cash provided by operating activities: Depreciation and amortization 70,878 89,710 70,042 Amortization of debt discount and debt issuance costs 21,031 27,179 29,070 Stock-based compensation expense 210,645 226,705 242,344 Impairment of long-lived assets — — 7,505 Other (5,039) 1,336 7,340 Changes in operating assets and liabilities, net of effects of acquisitions: Accounts receivable, net (135,649) (79,442) 410 Inventory (12,289) 2,393 (8,690) Deferred commissions (27,660) (24,231) (48,721) Prepaid expenses and other assets (6,972) (16,734) (33,982) Operating lease right-of-use assets — 26,511 28,804 Accounts payable 14,293 (18,856) (14,364) Accrued compensation and other liabilities 51,810 20,296 76,972 Operating lease liabilities — (25,377) (27,318) Deferred revenue 161,737 161,071 140,305 Net cash provided by operating activities 164,423 189,574 187,641 CASH FLOWS FROM INVESTING ACTIVITIES Purchases of property and equipment (100,246) (87,847) (94,975) Acquisitions, net of cash acquired (13,899) (51,594) (339,641) Purchase of intangible assets — (9,000) — Purchases of marketable securities (665,357) (795,580) (573,959) Sales of marketable securities 19,878 200,251 171,530 Maturities of marketable securities 253,280 419,059 423,936 Other (5,000) — (5,000) Net cash used in investing activities (511,344) (324,711) (418,109) CASH FLOWS FROM FINANCING ACTIVITIES Net proceeds from exercise of stock options 47,771 42,899 59,339 Proceeds from issuance of common stock under employee stock purchase plan 33,444 43,298 32,439 Proceeds from issuance of convertible senior notes, net of issuance costs 562,062 — — Payment for purchase of capped calls (64,630) — — Proceeds from borrowings, net of issuance costs — — 251,892 Repayment of debt assumed from acquisition (6,101) (11,555) — Tax withholding on vesting of equity awards (632) (10,379) (8,258) Repurchases of common stock (20,000) (15,017) (135,175) Net cash provided by financing activities 551,914 49,246 200,237 Net increase (decrease) in cash, cash equivalents and restricted cash 204,993 (85,891) (30,231) Cash, cash equivalents and restricted cash, beginning of year 258,820 463,813 377,922 Cash, cash equivalents and restricted cash, end of year $ 463,813 $ 377,922 $ 347,691 CASH, CASH EQUIVALENTS AND RESTRICTED CASH AT END OF YEAR Cash and cash equivalents $ 447,990 $ 362,635 $ 337,147 Restricted cash $ 15,823 $ 15,287 $ 10,544 $ 463,813 $ 377,922 $ 347,691 Cash, cash equivalents and restricted cash, end of year SUPPLEMENTAL DISCLOSURES OF CASH FLOW INFORMATION Cash paid for interest $ 371 $ 718 $ 2,279 Cash paid for income taxes $ 4,696 $ 4,824 $ 10,522 $ — $ 32,785 $ 36,980 Cash paid for amounts included in the measurement of lease liabilities SUPPLEMENTAL DISCLOSURES OF NON-CASH INVESTING AND FINANCING INFORMATION Property and equipment purchased but not yet paid $ 13,873 $ 6,814 $ 10,979 Operating lease right-of-use assets obtained in exchange for operating lease liabilities $ — $ 14,937 $ 57,471 Acquisition consideration held back to satisfy potential indemnification claims $ 3,725 $ — $ — Vesting of early exercised stock options $ 320 $ — $ — Fair value of equity awards assumed in an acquisition $ — $ — $ 8,802 See the accompanying notes to the consolidated financial statements. 62
 Annua lReport Page 61 Page 63