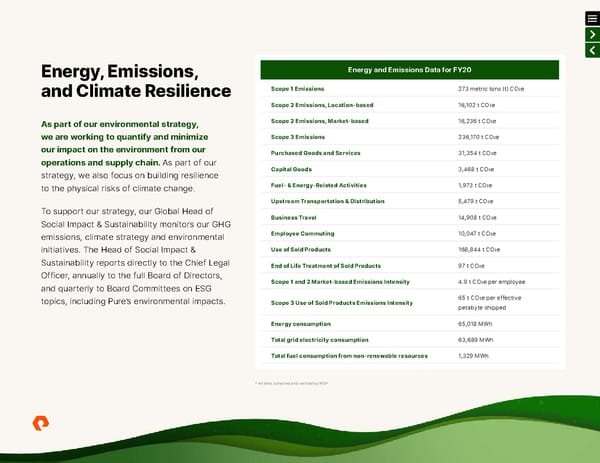
Energy, Emissions, Energy and Emissions Data for FY20 and Climate Resilience Scope 1 Emissions 273 metric tons (t) CO2e Scope 2 Emissions, Location-based 16,102 t CO2e As part of our environmental strategy, Scope 2 Emissions, Market-based 16,236 t CO2e we are working to quantify and minimize Scope 3 Emissions 236,170 t CO2e our impact on the environment from our Purchased Goods and Services 31,354 t CO2e operations and supply chain. As part of our strategy, we also focus on building resilience Capital Goods 3,468 t CO2e to the physical risks of climate change. Fuel- & Energy-Related Activities 1,973 t CO2e Upstream Transportation & Distribution 5,479 t CO2e To support our strategy, our Global Head of Social Impact & Sustainability monitors our GHG Business Travel 14,908 t CO2e emissions, climate strategy and environmental Employee Commuting 10,047 t CO2e initiatives. The Head of Social Impact & Use of Sold Products 168,844 t CO2e Sustainability reports directly to the Chief Legal End of Life Treatment of Sold Products 97 t CO2e Officer, annually to the full Board of Directors, and quarterly to Board Committees on ESG Scope 1 and 2 Market-based Emissions Intensity 4.9 t CO2e per employee topics, including Pure’s environmental impacts. Scope 3 Use of Sold Products Emissions Intensity 65 t CO2e per effective petabyte shipped Energy consumption 65,018 MWh Total grid electricity consumption 63,689 MWh Total fuel consumption from non-renewable resources 1,329 MWh * All data collected and verified by WSP
 ESG Report | Pure Storage Page 23 Page 25