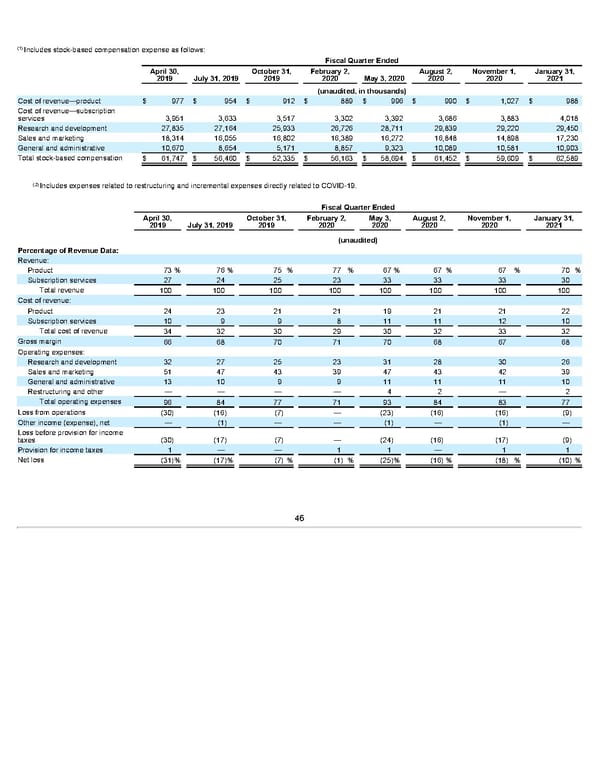
(1) Includes stock-based compensation expense as follows: Fiscal Quarter Ended April 30, October 31, February 2, August 2, November 1, January 31, 2019 July 31, 2019 2019 2020 May 3, 2020 2020 2020 2021 (unaudited, in thousands) Cost of revenue—product $ 977 $ 954 $ 912 $ 889 $ 996 $ 990 $ 1,027 $ 988 Cost of revenue—subscription services 3,951 3,633 3,517 3,302 3,392 3,686 3,883 4,018 Research and development 27,835 27,164 25,933 26,726 28,711 29,839 29,220 29,450 Sales and marketing 18,314 16,055 16,802 16,389 16,272 16,848 14,898 17,230 General and administrative 10,670 8,654 5,171 8,857 9,323 10,089 10,581 10,903 Total stock-based compensation $ 61,747 $ 56,460 $ 52,335 $ 56,163 $ 58,694 $ 61,452 $ 59,609 $ 62,589 (2) Includes expenses related to restructuring and incremental expenses directly related to COVID-19. Fiscal Quarter Ended April 30, October 31, February 2, May 3, August 2, November 1, January 31, 2019 July 31, 2019 2019 2020 2020 2020 2020 2021 (unaudited) Percentage of Revenue Data: Revenue: Product 73 % 76 % 75 % 77 % 67 % 67 % 67 % 70 % Subscription services 27 24 25 23 33 33 33 30 Total revenue 100 100 100 100 100 100 100 100 Cost of revenue: Product 24 23 21 21 19 21 21 22 Subscription services 10 9 9 8 11 11 12 10 Total cost of revenue 34 32 30 29 30 32 33 32 Gross margin 66 68 70 71 70 68 67 68 Operating expenses: Research and development 32 27 25 23 31 28 30 26 Sales and marketing 51 47 43 39 47 43 42 39 General and administrative 13 10 9 9 11 11 11 10 Restructuring and other — — — — 4 2 — 2 Total operating expenses 96 84 77 71 93 84 83 77 Loss from operations (30) (16) (7) — (23) (16) (16) (9) Other income (expense), net — (1) — — (1) — (1) — Loss before provision for income taxes (30) (17) (7) — (24) (16) (17) (9) Provision for income taxes 1 — — 1 1 — 1 1 Net loss (31)% (17)% (7) % (1) % (25)% (16) % (18) % (10) % 46
 Annua lReport Page 45 Page 47