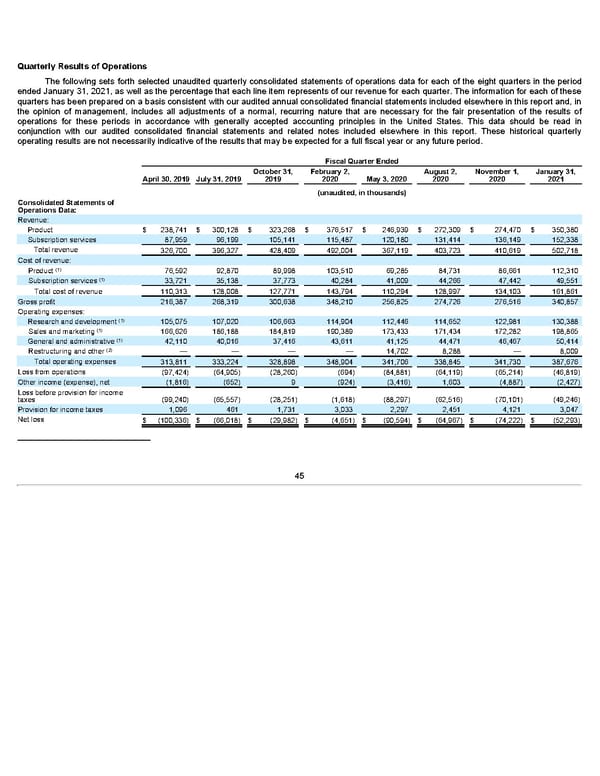
Quarterly Results of Operations The following sets forth selected unaudited quarterly consolidated statements of operations data for each of the eight quarters in the period ended January 31, 2021, as well as the percentage that each line item represents of our revenue for each quarter. The information for each of these quarters has been prepared on a basis consistent with our audited annual consolidated financial statements included elsewhere in this report and, in the opinion of management, includes all adjustments of a normal, recurring nature that are necessary for the fair presentation of the results of operations for these periods in accordance with generally accepted accounting principles in the United States. This data should be read in conjunction with our audited consolidated financial statements and related notes included elsewhere in this report. These historical quarterly operating results are not necessarily indicative of the results that may be expected for a full fiscal year or any future period. Fiscal Quarter Ended October 31, February 2, August 2, November 1, January 31, April 30, 2019 July 31, 2019 2019 2020 May 3, 2020 2020 2020 2021 (unaudited, in thousands) Consolidated Statements of Operations Data: Revenue: Product $ 238,741 $ 300,128 $ 323,268 $ 376,517 $ 246,939 $ 272,309 $ 274,470 $ 350,380 Subscription services 87,959 96,199 105,141 115,487 120,180 131,414 136,149 152,338 Total revenue 326,700 396,327 428,409 492,004 367,119 403,723 410,619 502,718 Cost of revenue: (1) Product 76,592 92,870 89,998 103,510 69,285 84,731 86,661 112,310 (1) Subscription services 33,721 35,138 37,773 40,284 41,009 44,266 47,442 49,551 Total cost of revenue 110,313 128,008 127,771 143,794 110,294 128,997 134,103 161,861 Gross profit 216,387 268,319 300,638 348,210 256,825 274,726 276,516 340,857 Operating expenses: (1) Research and development 105,075 107,020 106,663 114,904 112,446 114,652 122,981 130,388 (1) Sales and marketing 166,626 186,188 184,819 190,389 173,433 171,434 172,282 198,865 (1) General and administrative 42,110 40,016 37,416 43,611 41,125 44,471 46,467 50,414 (2) Restructuring and other — — — — 14,702 8,288 — 8,009 Total operating expenses 313,811 333,224 328,898 348,904 341,706 338,845 341,730 387,676 Loss from operations (97,424) (64,905) (28,260) (694) (84,881) (64,119) (65,214) (46,819) Other income (expense), net (1,816) (652) 9 (924) (3,416) 1,603 (4,887) (2,427) Loss before provision for income taxes (99,240) (65,557) (28,251) (1,618) (88,297) (62,516) (70,101) (49,246) Provision for income taxes 1,096 461 1,731 3,033 2,297 2,451 4,121 3,047 Net loss $ (100,336) $ (66,018) $ (29,982) $ (4,651) $ (90,594) $ (64,967) $ (74,222) $ (52,293) _________________________________ 45
 Annua lReport Page 44 Page 46