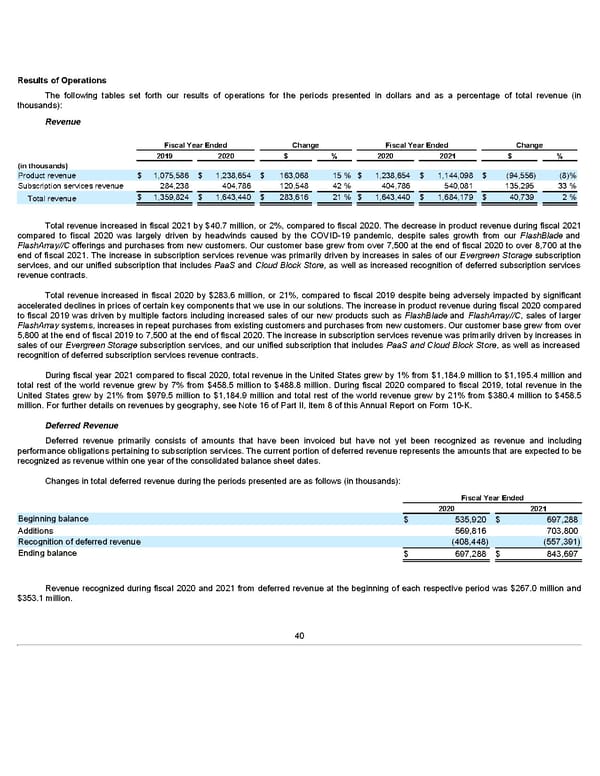
Results of Operations The following tables set forth our results of operations for the periods presented in dollars and as a percentage of total revenue (in thousands): Revenue Fiscal Year Ended Change Fiscal Year Ended Change 2019 2020 $ % 2020 2021 $ % (in thousands) Product revenue $ 1,075,586 $ 1,238,654 $ 163,068 15 % $ 1,238,654 $ 1,144,098 $ (94,556) (8)% Subscription services revenue 284,238 404,786 120,548 42 % 404,786 540,081 135,295 33 % $ 1,359,824 $ 1,643,440 $ 283,616 21 % $ 1,643,440 $ 1,684,179 $ 40,739 2 % Total revenue Total revenue increased in fiscal 2021 by $40.7 million, or 2%, compared to fiscal 2020. The decrease in product revenue during fiscal 2021 compared to fiscal 2020 was largely driven by headwinds caused by the COVID-19 pandemic, despite sales growth from our FlashBlade and FlashArray//C offerings and purchases from new customers. Our customer base grew from over 7,500 at the end of fiscal 2020 to over 8,700 at the end of fiscal 2021. The increase in subscription services revenue was primarily driven by increases in sales of our Evergreen Storage subscription services, and our unified subscription that includes PaaS and Cloud Block Store, as well as increased recognition of deferred subscription services revenue contracts. Total revenue increased in fiscal 2020 by $283.6 million, or 21%, compared to fiscal 2019 despite being adversely impacted by significant accelerated declines in prices of certain key components that we use in our solutions. The increase in product revenue during fiscal 2020 compared to fiscal 2019 was driven by multiple factors including increased sales of our new products such as FlashBlade and FlashArray//C, sales of larger FlashArray systems, increases in repeat purchases from existing customers and purchases from new customers. Our customer base grew from over 5,800 at the end of fiscal 2019 to 7,500 at the end of fiscal 2020. The increase in subscription services revenue was primarily driven by increases in sales of our Evergreen Storage subscription services, and our unified subscription that includes PaaS and Cloud Block Store, as well as increased recognition of deferred subscription services revenue contracts. During fiscal year 2021 compared to fiscal 2020, total revenue in the United States grew by 1% from $1,184.9 million to $1,195.4 million and total rest of the world revenue grew by 7% from $458.5 million to $488.8 million. During fiscal 2020 compared to fiscal 2019, total revenue in the United States grew by 21% from $979.5 million to $1,184.9 million and total rest of the world revenue grew by 21% from $380.4 million to $458.5 million. For further details on revenues by geography, see Note 16 of Part II, Item 8 of this Annual Report on Form 10-K. Deferred Revenue Deferred revenue primarily consists of amounts that have been invoiced but have not yet been recognized as revenue and including performance obligations pertaining to subscription services. The current portion of deferred revenue represents the amounts that are expected to be recognized as revenue within one year of the consolidated balance sheet dates. Changes in total deferred revenue during the periods presented are as follows (in thousands): Fiscal Year Ended 2020 2021 Beginning balance $ 535,920 $ 697,288 Additions 569,816 703,800 Recognition of deferred revenue (408,448) (557,391) Ending balance $ 697,288 $ 843,697 Revenue recognized during fiscal 2020 and 2021 from deferred revenue at the beginning of each respective period was $267.0 million and $353.1 million. 40
 Annua lReport Page 39 Page 41