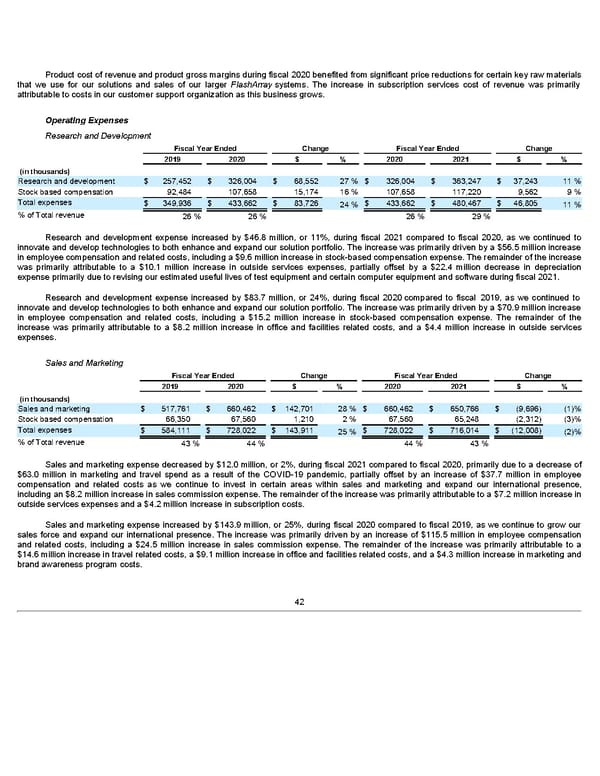
Product cost of revenue and product gross margins during fiscal 2020 benefited from significant price reductions for certain key raw materials that we use for our solutions and sales of our larger FlashArray systems. The increase in subscription services cost of revenue was primarily attributable to costs in our customer support organization as this business grows. Operating Expenses Research and Development Fiscal Year Ended Change Fiscal Year Ended Change 2019 2020 $ % 2020 2021 $ % (in thousands) Research and development $ 257,452 $ 326,004 $ 68,552 27 % $ 326,004 $ 363,247 $ 37,243 11 % Stock based compensation 92,484 107,658 15,174 16 % 107,658 117,220 9,562 9 % Total expenses $ 349,936 $ 433,662 $ 83,726 $ 433,662 $ 480,467 $ 46,805 24 % 11 % % of Total revenue 26 % 26 % 26 % 29 % Research and development expense increased by $46.8 million, or 11%, during fiscal 2021 compared to fiscal 2020, as we continued to innovate and develop technologies to both enhance and expand our solution portfolio. The increase was primarily driven by a $56.5 million increase in employee compensation and related costs, including a $9.6 million increase in stock-based compensation expense. The remainder of the increase was primarily attributable to a $10.1 million increase in outside services expenses, partially offset by a $22.4 million decrease in depreciation expense primarily due to revising our estimated useful lives of test equipment and certain computer equipment and software during fiscal 2021. Research and development expense increased by $83.7 million, or 24%, during fiscal 2020 compared to fiscal 2019, as we continued to innovate and develop technologies to both enhance and expand our solution portfolio. The increase was primarily driven by a $70.9 million increase in employee compensation and related costs, including a $15.2 million increase in stock-based compensation expense. The remainder of the increase was primarily attributable to a $8.2 million increase in office and facilities related costs, and a $4.4 million increase in outside services expenses. Sales and Marketing Fiscal Year Ended Change Fiscal Year Ended Change 2019 2020 $ % 2020 2021 $ % (in thousands) Sales and marketing $ 517,761 $ 660,462 $ 142,701 28 % $ 660,462 $ 650,766 $ (9,696) (1)% Stock based compensation 66,350 67,560 1,210 2 % 67,560 65,248 (2,312) (3)% Total expenses $ 584,111 $ 728,022 $ 143,911 $ 728,022 $ 716,014 $ (12,008) 25 % (2)% % of Total revenue 43 % 44 % 44 % 43 % Sales and marketing expense decreased by $12.0 million, or 2%, during fiscal 2021 compared to fiscal 2020, primarily due to a decrease of $63.0 million in marketing and travel spend as a result of the COVID-19 pandemic, partially offset by an increase of $37.7 million in employee compensation and related costs as we continue to invest in certain areas within sales and marketing and expand our international presence, including an $8.2 million increase in sales commission expense. The remainder of the increase was primarily attributable to a $7.2 million increase in outside services expenses and a $4.2 million increase in subscription costs. Sales and marketing expense increased by $143.9 million, or 25%, during fiscal 2020 compared to fiscal 2019, as we continue to grow our sales force and expand our international presence. The increase was primarily driven by an increase of $115.5 million in employee compensation and related costs, including a $24.5 million increase in sales commission expense. The remainder of the increase was primarily attributable to a $14.6 million increase in travel related costs, a $9.1 million increase in office and facilities related costs, and a $4.3 million increase in marketing and brand awareness program costs. 42
 Annua lReport Page 41 Page 43