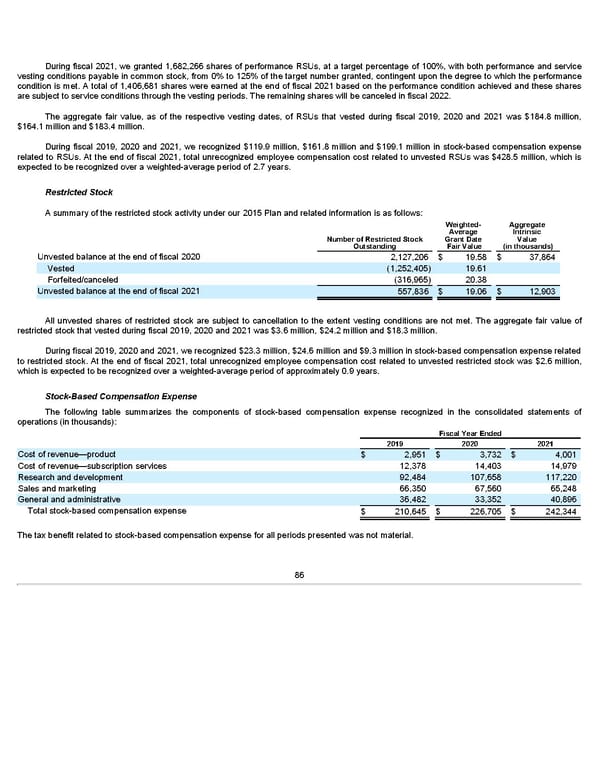
During fiscal 2021, we granted 1,682,266 shares of performance RSUs, at a target percentage of 100%, with both performance and service vesting conditions payable in common stock, from 0% to 125% of the target number granted, contingent upon the degree to which the performance condition is met. A total of 1,406,681 shares were earned at the end of fiscal 2021 based on the performance condition achieved and these shares are subject to service conditions through the vesting periods. The remaining shares will be canceled in fiscal 2022. The aggregate fair value, as of the respective vesting dates, of RSUs that vested during fiscal 2019, 2020 and 2021 was $184.8 million, $164.1 million and $183.4 million. During fiscal 2019, 2020 and 2021, we recognized $119.9 million, $161.8 million and $199.1 million in stock-based compensation expense related to RSUs. At the end of fiscal 2021, total unrecognized employee compensation cost related to unvested RSUs was $428.5 million, which is expected to be recognized over a weighted-average period of 2.7 years. Restricted Stock A summary of the restricted stock activity under our 2015 Plan and related information is as follows: Weighted- Aggregate Average Intrinsic Number of Restricted Stock Grant Date Value Outstanding Fair Value (in thousands) Unvested balance at the end of fiscal 2020 2,127,206 $ 19.58 $ 37,864 Vested (1,252,405) 19.61 Forfeited/canceled (316,965) 20.38 Unvested balance at the end of fiscal 2021 557,836 $ 19.06 $ 12,903 All unvested shares of restricted stock are subject to cancellation to the extent vesting conditions are not met. The aggregate fair value of restricted stock that vested during fiscal 2019, 2020 and 2021 was $3.6 million, $24.2 million and $18.3 million. During fiscal 2019, 2020 and 2021, we recognized $23.3 million, $24.6 million and $9.3 million in stock-based compensation expense related to restricted stock. At the end of fiscal 2021, total unrecognized employee compensation cost related to unvested restricted stock was $2.6 million, which is expected to be recognized over a weighted-average period of approximately 0.9 years. Stock-Based Compensation Expense The following table summarizes the components of stock-based compensation expense recognized in the consolidated statements of operations (in thousands): Fiscal Year Ended 2019 2020 2021 Cost of revenue—product $ 2,951 $ 3,732 $ 4,001 Cost of revenue—subscription services 12,378 14,403 14,979 Research and development 92,484 107,658 117,220 Sales and marketing 66,350 67,560 65,248 General and administrative 36,482 33,352 40,896 Total stock-based compensation expense $ 210,645 $ 226,705 $ 242,344 The tax benefit related to stock-based compensation expense for all periods presented was not material. 86
 Annua lReport Page 85 Page 87