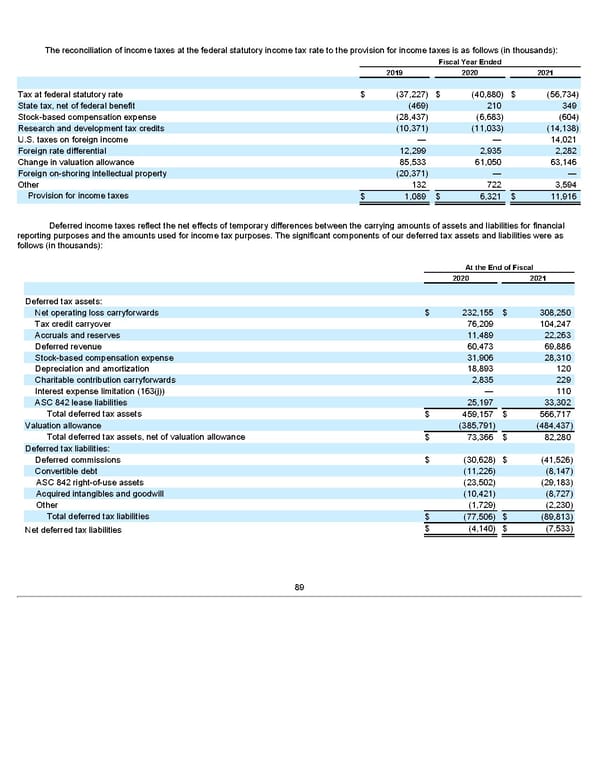
The reconciliation of income taxes at the federal statutory income tax rate to the provision for income taxes is as follows (in thousands): Fiscal Year Ended 2019 2020 2021 Tax at federal statutory rate $ (37,227) $ (40,880) $ (56,734) State tax, net of federal benefit (469) 210 349 Stock-based compensation expense (28,437) (6,683) (604) Research and development tax credits (10,371) (11,033) (14,138) U.S. taxes on foreign income — — 14,021 Foreign rate differential 12,299 2,935 2,282 Change in valuation allowance 85,533 61,050 63,146 Foreign on-shoring intellectual property (20,371) — — Other 132 722 3,594 Provision for income taxes $ 1,089 $ 6,321 $ 11,916 Deferred income taxes reflect the net effects of temporary differences between the carrying amounts of assets and liabilities for financial reporting purposes and the amounts used for income tax purposes. The significant components of our deferred tax assets and liabilities were as follows (in thousands): At the End of Fiscal 2020 2021 Deferred tax assets: Net operating loss carryforwards $ 232,155 $ 308,250 Tax credit carryover 76,209 104,247 Accruals and reserves 11,489 22,263 Deferred revenue 60,473 69,886 Stock-based compensation expense 31,906 28,310 Depreciation and amortization 18,893 120 Charitable contribution carryforwards 2,835 229 Interest expense limitation (163(j)) — 110 ASC 842 lease liabilities 25,197 33,302 Total deferred tax assets $ 459,157 $ 566,717 Valuation allowance (385,791) (484,437) Total deferred tax assets, net of valuation allowance $ 73,366 $ 82,280 Deferred tax liabilities: Deferred commissions $ (30,628) $ (41,526) Convertible debt (11,226) (8,147) ASC 842 right-of-use assets (23,502) (29,183) Acquired intangibles and goodwill (10,421) (8,727) Other (1,729) (2,230) Total deferred tax liabilities $ (77,506) $ (89,813) $ (4,140) $ (7,533) Net deferred tax liabilities 89
 Annua lReport Page 88 Page 90